If you trade in Options or Futures, you’ve likely heard the golden rule: “The trend is your friend.” But how do you identify the real-time trend before a big move happens? The ultimate secret lies in tracking FII DII Open Interest (OI) Data.
Welcome to appsportal.in! Today, we are breaking down an advanced Excel analysis setup that reveals exactly what the “Smart Money” (FIIs and Pro Traders) is doing, and where Retail traders might be getting trapped.
Download : https://t.me/intraday_trading_setup
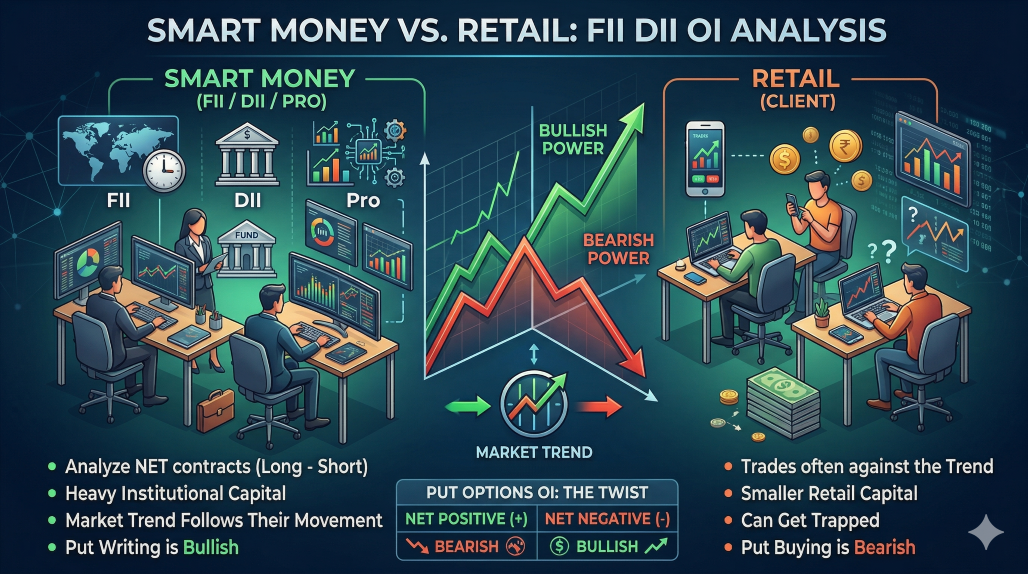
The 4 Major Market Participants
When we analyze NSE Open Interest (OI) data, we categorize market players into four main groups:
- Client (Retailers): Regular retail traders like you and me. Historically, retail sentiment often moves in the opposite direction of the actual market trend.
- DII (Domestic Institutional Investors): Indian mutual funds, banks, and large domestic institutions. They are primarily active in the cash market, and their F&O positions are generally used for hedging.
- FII (Foreign Institutional Investors): The biggest market movers. They deploy massive capital, and the broader market trend usually follows their F&O activity.
- Pro Traders: Proprietary trading desks and HNIs (High Net-worth Individuals) who use advanced algorithms and heavy volume strategies.
How to Read “Net” Open Interest (OI) Data?
In our Free FII DII Excel template, we focus on “Net” contracts (Long positions minus Short positions). Here is the simple rulebook to decode this data:
- Index/Stock Futures & Call Options:
- If Net Data is Positive (+) = Bullish (Expectation of an uptrend)
- If Net Data is Negative (-) = Bearish (Expectation of a downtrend)
- Put Options (The Twist):
- If Net Data is Positive (+) = Puts have been bought = Bearish
- If Net Data is Negative (-) = Puts have been shorted (written) = Bullish
💡 Pro Tip: Heavy put writing (highly negative data) by institutions is a very strong bullish signal. Big players write options to collect premium, expecting the market to stay well above that level.
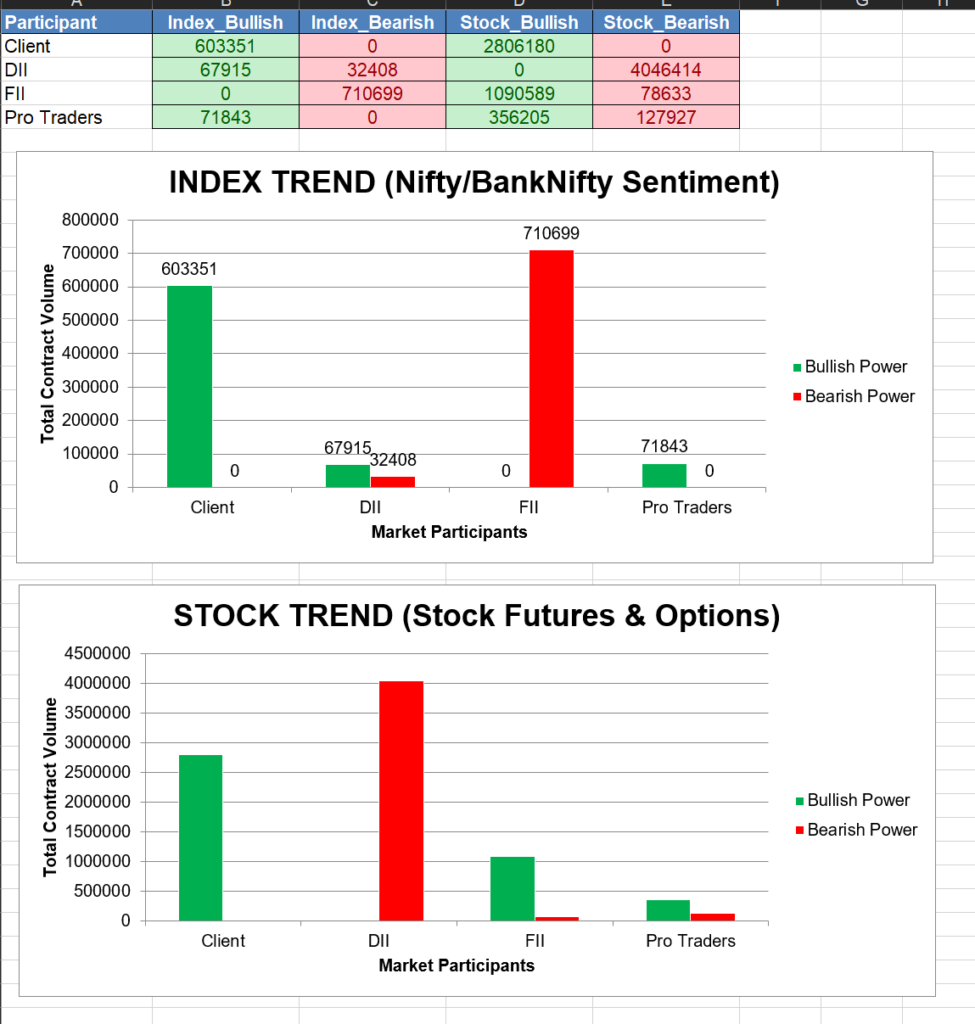
How to Identify the Market Trend (The Smart Money Strategy)
Our Excel Dashboard calculates the total “Bullish Power” and “Bearish Power” separately. To predict the next market move, you only need to observe two main divergences:
1. Index Trend (Nifty / BankNifty)
To find the trend in the Index, compare the behavior of FIIs and Clients.
- If Clients are aggressively Bullish (holding heavy long positions) while FIIs are heavily Bearish (creating massive short positions), there is a very high probability of a sharp down-move. Smart Money almost always trades opposite to Retail sentiment.
2. Stock Trend (Stock Futures & Options)
Sometimes, the broader Index is falling, but individual stocks continue to rally. To catch this, check the Stock Trend analysis.
- If FIIs are bearish on the Index but hold consistently long (bullish) positions in Stock Futures, it indicates “Stock-specific action.” This means the broader market may consolidate or fall, but specific sectors or stocks will heavily outperform.
Conclusion: Trade with Data, Not Just Emotions
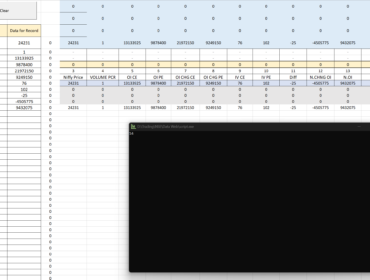
Relying purely on chart patterns without understanding the underlying institutional data can be risky. With our FII DII Analyzer Excel sheet, you can accurately map daily market sentiment and track Institutional footprints before the market opens the next day.
(👉 Insert screenshots of your Excel Dashboard and Bar Charts here to show users what the tool looks like!)
Disclaimer: This data is sourced from the National Stock Exchange (NSE) website on an end-of-day basis. This Excel template and analysis are purely for Educational Purposes. We do not provide direct buy/sell recommendations. Always follow strict risk management.
For more useful trading tools, automated setups, and algorithms, keep visiting appsportal.in. Happy Trading!