Algorithmic trading is all about finding confluence. When intraday and swing trading, relying on a single metric often leads to false breakouts and premature stop-outs. To navigate high-volatility markets, you need a system that processes multiple data points—volume, momentum, trend geometry, and volatility—simultaneously.
Enter the Swing Master, a highly sophisticated, multi-layered TradingView indicator designed to strip the emotion out of your trading and replace it with pure, data-driven probability. Exclusively developed for traders who demand precision, this tool integrates advanced quantitative filters to pinpoint exact entry and continuation zones.
Here is a deep dive into how this powerful algorithmic tool works and how it can transform your daily market analysis.
Tradingview Link : https://www.tradingview.com/script/3gwxg777-Swing-Master-Intraday-with-Probabilities/
Core Features of the Swing Master System
The Swing Master isn’t just a simple crossover tool; it is a comprehensive trading dashboard that runs complex algorithmic calculations in the background, presenting you with clean, actionable signals on your chart.
1. The Real-Time Probability Matrix
Instead of guessing market direction, the indicator calculates a live Bullish and Bearish Probability Score (0-100%). It achieves this by weighting three critical market conditions:
- Trend Alignment (30% Weight): Evaluates the price action relative to the 50-period SMA.
- Momentum (25% Weight): Utilizes the RSI (Relative Strength Index) to gauge localized strength.
- Volume Surges (20% Weight): Compares live volume against a 20-period average to ensure institutional participation.
- Volatility Filter: Dynamically adjusts the probability weight by tracking the Average True Range (ATR). If the market becomes highly volatile, the algorithm adapts, keeping you on the right side of explosive moves.
2. Multi-Timeframe (MTF) Supertrend & Angle Detection
Trend-following is lucrative, but catching a trend just as it gains explosive momentum is the holy grail. The Swing Master utilizes an advanced MTF Supertrend that tracks the higher timeframe (e.g., 4-hour or Daily) while you trade on a lower timeframe.
More importantly, it calculates the geometric angle of the trendline. When a trend breaks out with an angle exceeding 70 degrees alongside a massive volume spike, the indicator flags this as a high-probability volatility blast.
3. Quantitative Qualitative Estimation (QQE) & Blast Off Momentum (BOM)
To filter out market noise, the indicator deploys a QQE trend filter combined with a custom BOM calculation. This ensures that signals are only generated when momentum is genuinely accelerating, keeping you out of choppy, sideways consolidation zones.
4. Dynamic Support & Resistance Mapping
No more drawing manual lines. The script automatically identifies significant Pivot Highs and Pivot Lows, extending dashed lines forward to map out crucial future liquidity zones and breakout thresholds.
How to Read the Signals
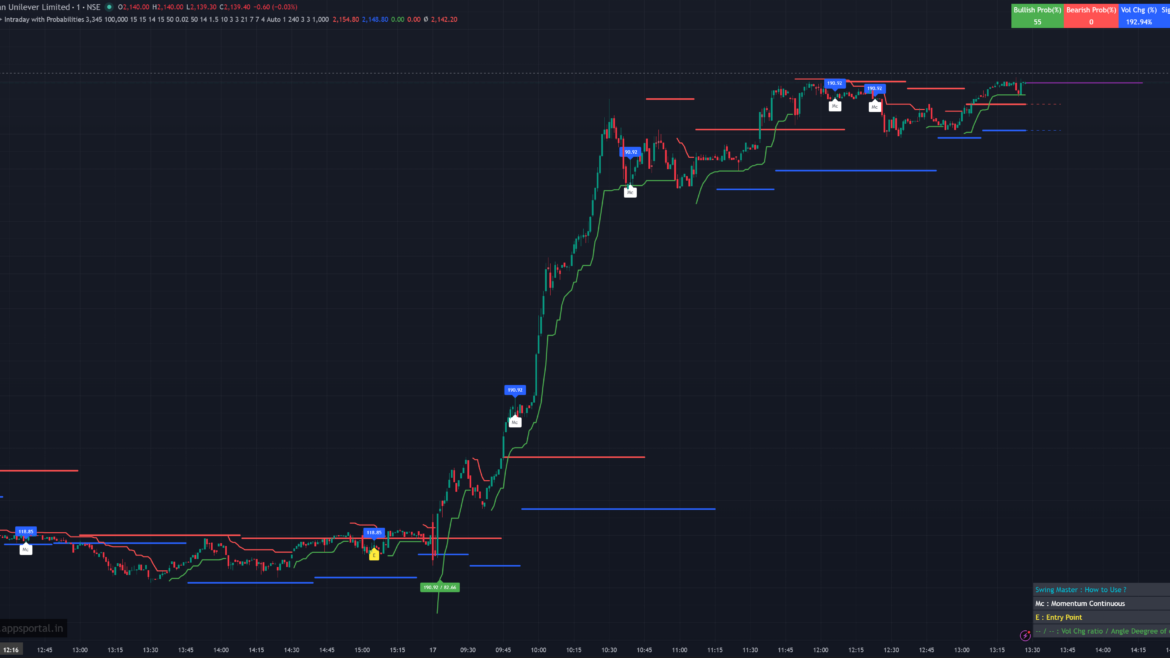
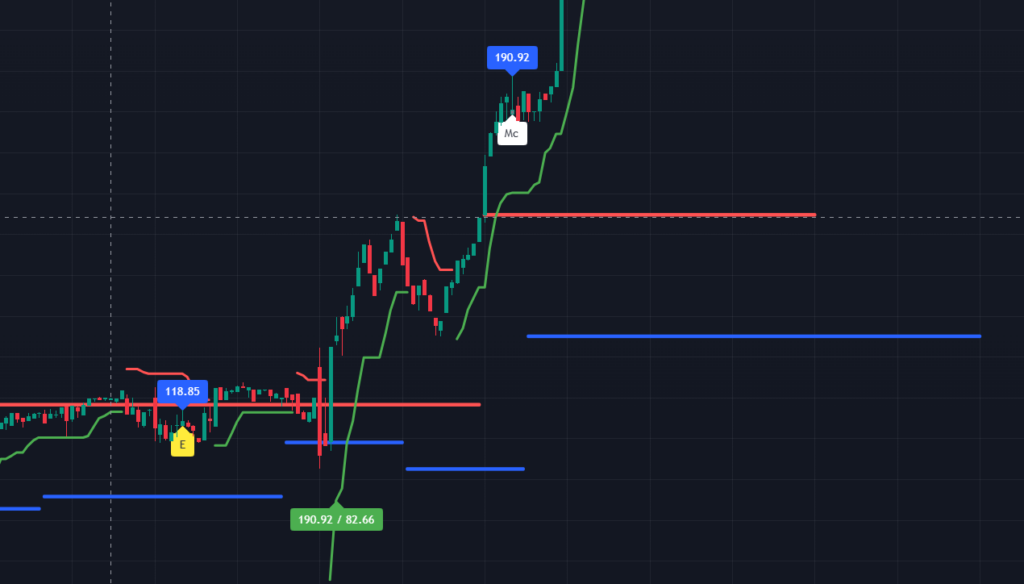
The Swing Master chart is designed for instant visual processing. Here is the exact breakdown of the signals you will see printed on your charts:
- “E” (Entry Point): This yellow label is your optimal entry trigger. It fires when the market is severely oversold or overbought (measured by Williams %R) while aligning with the broader algorithmic trend, catching the exact pivot point for a swing.
- “Mc” (Momentum Continuous): This white label appears during an established trend. It identifies micro-pullbacks or Doji/Hammer candle formations that present safe, low-risk opportunities to add to an existing winning position.
- Angle & Volume Labels (e.g., 150.5 / 72.4): When the MTF Supertrend shifts violently, you will see a combined label. The first number represents the Volume Change Ratio (showing a massive influx of capital), and the second is the Angle Degree of the trend. A steep angle with high volume confirms institutional breakout buying or selling.
- On-Chart Dashboard: A clean, color-coded table stays anchored to your screen, providing a real-time summary of the Bullish/Bearish probabilities, live volume changes, and the current overarching signal.
Strategic Risk Management
Because this indicator tracks ATR and volume dynamically, it naturally filters out low-probability environments. However, traders should leverage the built-in Middle Price weighting and Dynamic Pivot lines to trail stop-losses effectively. By placing stop-losses just behind the algorithmic Supertrend line or the automated support zones, you protect your capital from sudden wick-outs while giving the trade room to breathe.
Final Thoughts
The Swing Master brings institutional-grade quantitative analysis directly to your TradingView charts. By marrying MTF trend direction with localized volume blasts and geometric angle calculations, it removes the guesswork from technical analysis.
Whether you are scalping volatile indices or managing multi-day swings on commodities and crypto, this indicator provides the definitive edge required to stay consistently profitable.
Ready to integrate this level of algorithmic precision into your daily trading? Lifetime access to premium tools, custom indicators, and advanced trading systems are available directly through AppsPortal.in.