If you are trading NIFTY 50 or Index based only on pure price action, you are missing half the picture. The real secret to consistent trading lies in tracking Institutional Flow (Smart Money) and real-time Open Interest (OI) dynamics.
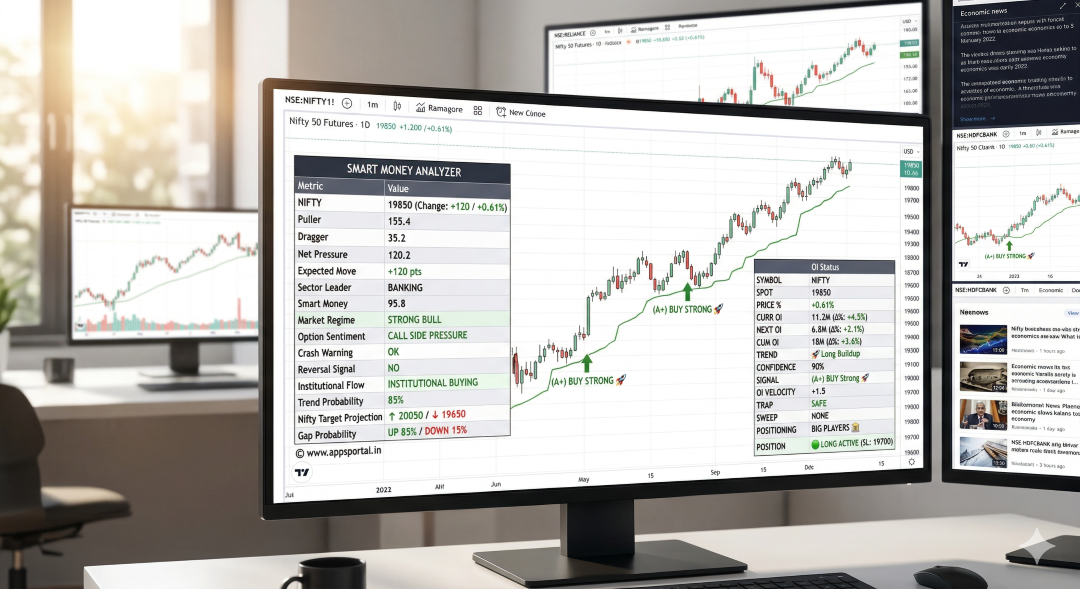
Introducing the SMART MONEY ANALYZER, a revolutionary TradingView indicator designed to look under the hood of the stock market. It doesn’t just tell you where the market is going; it tells you who is moving it and how strong the move really is.
Here is a deep dive into how this powerful tool can transform your intraday trading strategy.
Use Free from Tradingview at : https://www.tradingview.com/script/FnOF2NNL-Smart-Money-Analyzer/
🌟 Core Features of the Smart Money Analyzer
This indicator is built on two primary engines: The Weightage Engine and the OI (Open Interest) Analytics Engine.
1. The Weightage Engine: Pullers vs. Draggers
NIFTY doesn’t move on its own—it moves because its constituent stocks move. This indicator tracks the real-time performance of 14 key heavyweight stocks (like Reliance, HDFC Bank, ICICI Bank, Infosys, etc.) and calculates their exact point contribution to Nifty.
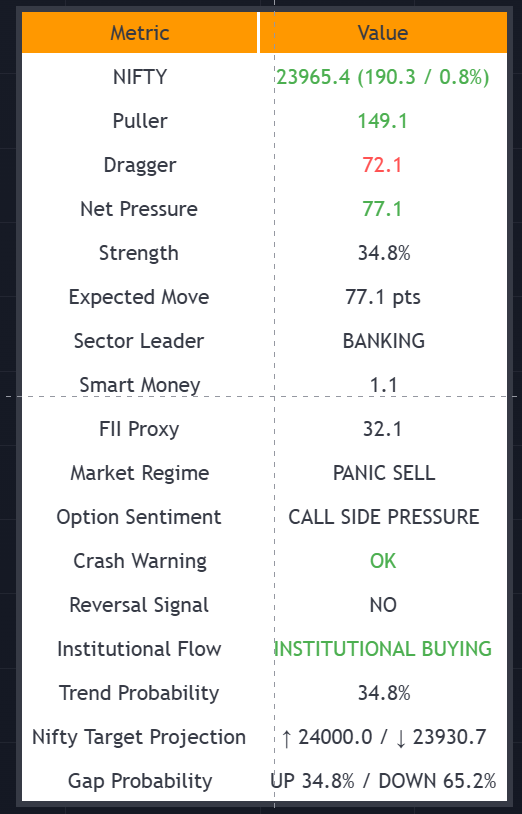
- Pullers: Heavyweights driving the market UP.
- Draggers: Heavyweights pulling the market DOWN.
- Net Pressure & Expected Move: Instantly see the mathematical net pressure on the index and the expected point movement based on heavyweight contribution.
2. Sectoral Heat & FII Proxy
Instead of checking multiple sector charts, the Smart Money Analyzer groups the contributions into core sectors:
- Banking, IT, and Auto Engines: Instantly identifies the “Sector Leader” of the day.
- Smart Money & FII Proxy: By tracking the combined pressure of top heavyweights (Banking + IT), the indicator identifies if institutions are in an accumulation or distribution phase.
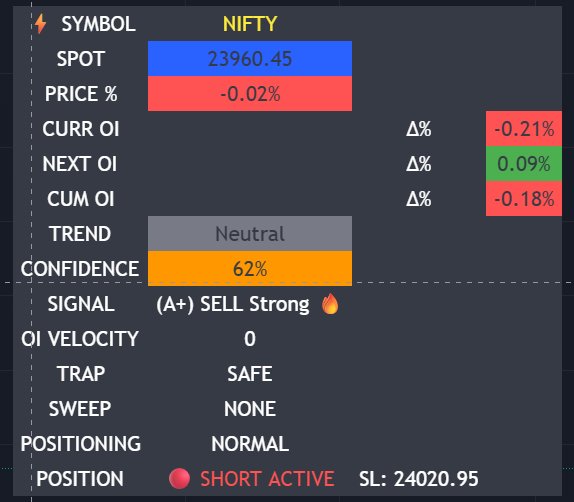
3. Advanced Open Interest (OI) Decoding
Price alone can be manipulated, but Open Interest reveals true intent. The script fetches real-time Current and Next Month OI data to identify market positioning:
- Long Buildup (🚀): Price Up + OI Up. Fresh buyers are entering.
- Short Covering (📈): Price Up + OI Down. Option sellers are panicking and exiting.
- Short Buildup (🔥): Price Down + OI Up. Fresh institutional selling pressure.
- Long Unwinding (📉): Price Down + OI Down. Weak hands are exiting their long positions.
4. Smart Trap & Sweep Detection
Retail traders often get caught in false breakouts. This indicator includes a proprietary algorithm to detect:
- Bull/Bear Traps: Spots anomalies where price spikes but OI data indicates the opposite.
- Liquidity Sweeps: Identifies when big players sweep the high or low of the previous 20 sessions to grab liquidity before reversing the trend.
5. Automated Grading System & ATR Stop-Loss
You don’t need to guess the trend. The script analyzes volume spikes, ADX strength, Higher Timeframe (HTF) alignment, and OI velocity to generate a concrete score.
- A+ Signals: Highly probable, trend-aligned setups.
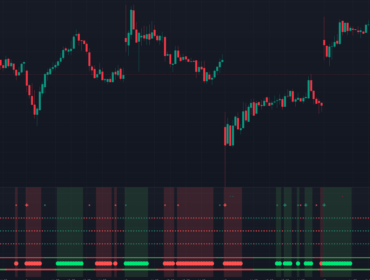
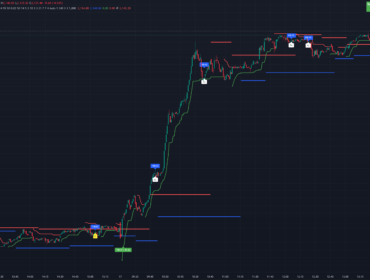
- Trailing Stop Loss: Once a position is active, the indicator dynamically plots an ATR-based trailing Stop Loss line (Green for Long, Red for Short) directly on your chart, ensuring strict risk management.
🛠️ How to Trade Using the Smart Money Analyzer
- Check the Market Regime: Look at the main table. Is it a “STRONG BULL” or “PANIC SELL” regime? Trade only in the direction of the regime.
- Verify the Institutional Flow: Ensure the “Smart Money” reading aligns with your bias. If institutions are buying, avoid shorting.
- Wait for the Signal: Look for an (A+) BUY Strong or (A+) SELL Strong signal. This ensures volume, ADX, and Open Interest are all backing your trade.
- Manage Risk: Enter the trade and strictly follow the dynamic ATR Trailing Stop Loss line plotted on the chart.
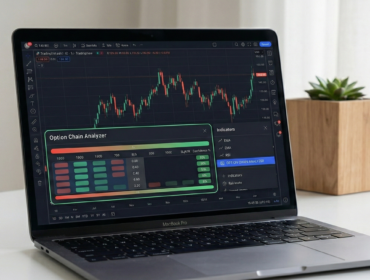
📊 Beautiful, Data-Rich Dashboards
The indicator provides two incredibly detailed, non-intrusive on-chart dashboards:
- Nifty Pressure Dashboard: Displays Strength %, Expected Move, Sector Leaders, Crash Warnings, and Reversal Signals.
- OI Status Dashboard: Tracks spot price, current vs. next month OI changes, trend confidence, and active trade positioning.
Take Your Trading to the Next Level
The Smart Money Analyzer takes the guesswork out of intraday trading. By combining heavyweight index math with derivative data, you are no longer trading blind—you are trading right alongside the institutions.
(Script engineered and developed by www.appsportal.in)

How can I get access to lakshmi indicator
Its Free, Just in indicator Properties enter Magic Number