In the world of intraday trading, data is king. While price action tells you what is happening, the Option Chain tells you why it’s happening. Understanding where the “Big Players” are positioning their money can be the difference between a winning trade and a trapped position.
To bridge this gap, we’ve developed the Option Chain Analyzer a comprehensive, free indicator for TradingView that brings deep-market derivatives data directly onto your price chart.
What is the Option Chain Analyzer?
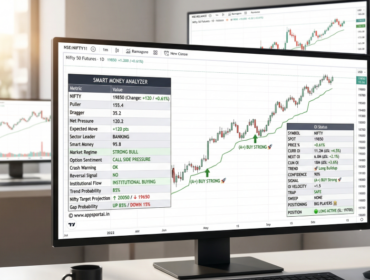
The Option Chain Analyzer is a multi-functional tool designed to visualize the tug-of-war between Bulls (Call writers) and Bears (Put writers). By processing Open Interest (OI), Volume, and Price change data in real-time, it provides a “Cheat Sheet” for market sentiment.
Get from : https://www.tradingview.com/script/VcGmliWX-Option-Chain-Analyzer/
Key Features at a Glance:
- Live Trend Sentiment: Instantly see if the market is “Strong Bullish,” “Cautious Bearish,” or “Neutral.”
- Strike-Level Granularity: Track specific strike prices for NIFTY, BANK NIFTY, and other major symbols.
- Built-in Filtering: Includes ADX Strength and Volume Spike filters to remove market noise.
- Risk Management: Automatically calculates Stop Loss (SL) levels based on ATR (Average True Range).
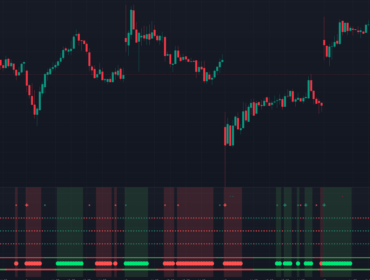
How to Read the Dashboard
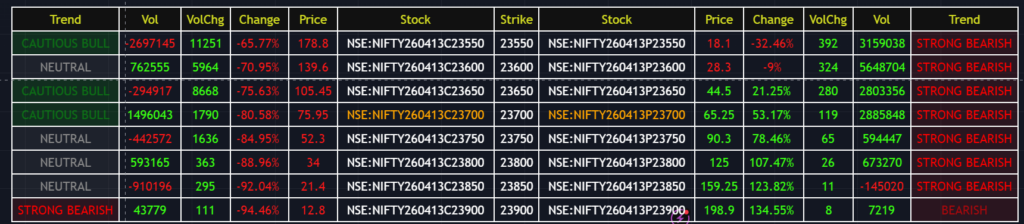
Your indicator provides a clean, HUD-style (Heads-Up Display) table at the bottom of your screen. Here is how to interpret the columns:
1. The Trend Column
- Strong Bullish/Bearish: Indicates a high-conviction move where Price and OI are aligned.
- Long Unwinding / Short Covering: Alerts you when a trend is losing steam because traders are closing their positions.
2. Volume & OI Change
Sudden spikes in VolChg (Volume Change) often precede a breakout. If you see a massive spike at a specific strike price, it indicates institutional activity.
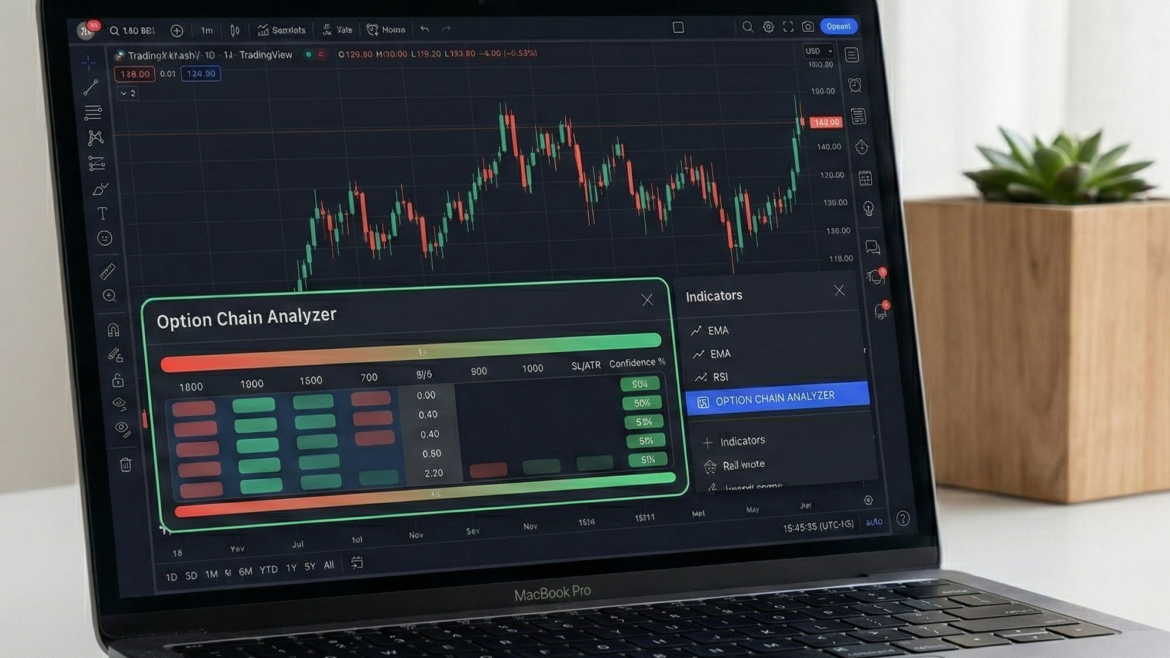
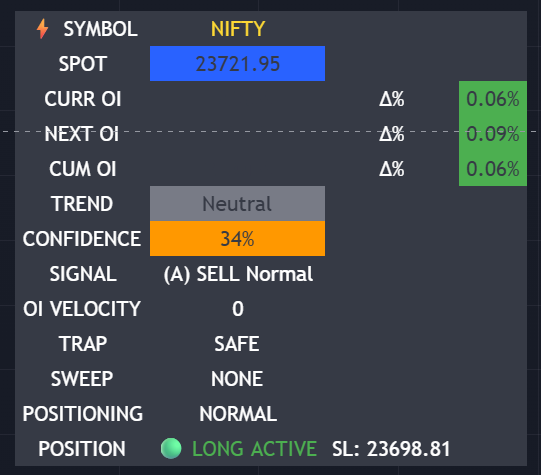
3. Signal & Confidence
The top-right panel provides a Confidence %.
Pro Tip: Never trade a signal with less than 50% confidence. Wait for the data to align with your price action strategy.
Customizing Your Setup
The power of this indicator lies in its flexibility. By opening the Inputs tab, you can tailor the tool to your specific trading style.
- Today’s Magic Number: A unique input field used to sync specific data feeds for the current session.
- HTF Confirmation: Use the “Higher Time Frame” confirmation (e.g., 15-minute) to ensure your 1-minute scalping trade isn’t going against the major trend.
- ATR Multiplier: Adjust your risk tolerance. A 2.2 multiplier (default) provides a balanced buffer for most intraday volatility.
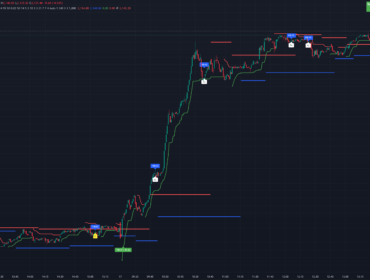
Why Use This Indicator?
- Stop Guessing Resistance: The highest Call OI acts as a natural ceiling. The highest Put OI acts as a natural floor. This indicator maps them for you.
- Avoid Traps: The “TRAP” signal on the dashboard warns you when retail traders are being caught on the wrong side of a “Sweep.”
- Free Forever: Unlike expensive external data tools, this Option Chain Analyzer is built directly for the TradingView community.