In the world of day trading and swing trading, “the trend is your friend” is the most repeated piece of advice for a reason. However, identifying a true trend versus a “fake-out” is the hardest part of the job.
To solve this, we’ve developed the Trend Meter Indicator, a comprehensive tool for TradingView that synchronizes multiple momentum and trend-following oscillators into one easy-to-read dashboard.
Indicator Link : https://www.tradingview.com/script/761FWIl4-Trend-Meter/
What is the Trend Meter Indicator?
The Trend Meter is a multi-layered technical analysis tool designed to filter out market noise. Instead of cluttering your chart with five different indicators, the Trend Meter processes the data in the background and presents it through a series of color-coded “meters.”
When all components align, it provides a high-probability signal that the market is moving in a definitive direction.
Key Components of the Meter:
- MACD Crossovers: Tracks momentum shifts using standard (12, 26, 9) or fast settings.
- RSI Relative Strength: Monitors whether the RSI is above or below the 50 level for bullish/bearish bias.
- Wave Trend (WT): High-precision detection of overbought and oversold conditions.
- Moving Average Crossovers: Uses customizable SMA/EMA lengths to confirm price action.
- Heikin Ashi Trend Candles: Smoothes out price volatility to show the underlying trend.
How to Read the Trend Meter
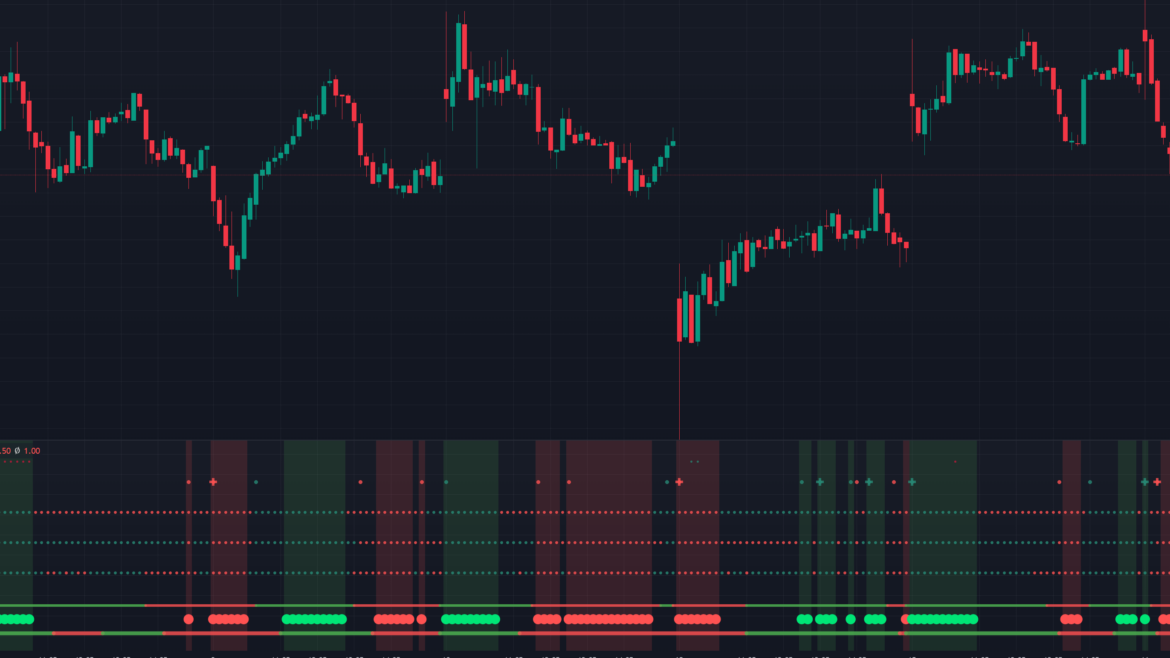
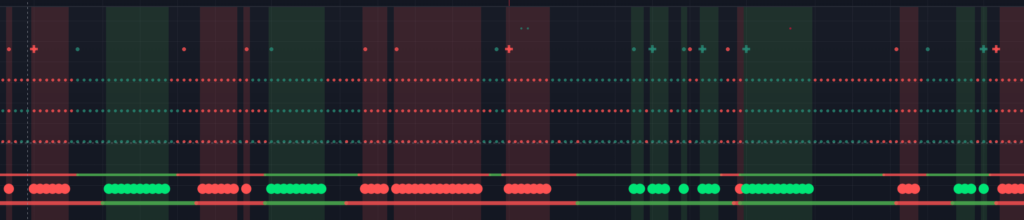
The indicator is displayed as a series of dots and lines at the bottom of your TradingView chart. Here is how to interpret the signals:
1. The Three Trend Dots (Meters 1-3)
These circles represent your core momentum filters. You can customize these to show RSI, MACD, or Top Dog Trading “Mom/Dad” crosses.
- Green Dot: Bullish alignment.
- Red Dot: Bearish alignment.
2. Positive & Negative Pressure (The Top Row)
The indicator calculates “Pressure” by looking at the RSI and Wave Trend simultaneously.
- Positive Pressure: Occurs when the RSI is oversold and the Wave Trend delta starts pointing up.
- Negative Pressure: Occurs when the RSI is overbought and the Wave Trend delta turns down.
3. The “All 5” Alignment Signal
This is the most powerful feature of the script. When all three Trend Meters and both Moving Average bars align in the same color, the background of your chart highlights, and a circle appears at the bottom.
Pro Tip: An “All 5” Green signal indicates a “confluence” where five different mathematical models agree that the trend is upward.
Key Features & Customization
The Trend Meter is highly flexible, making it suitable for both scalping and long-term investing.
| Feature | Description |
| Wave Trend X Alignment | Specifically highlights when a Wave Trend cross happens at the same time the Trend Meters align. |
| Custom MA Types | Choose between SMA and EMA for the Trend Bars to match your specific strategy. |
| Alert Support | Includes built-in alert conditions for “Positive/Negative Pressure” so you never miss a move. |
| Linear Regression RSI | Includes an advanced RSI Signal Line using Linear Regression for smoother trend detection. |
Trading Strategy: The “Full Alignment” Entry
To get the most out of the Trend Meter, many traders look for the Confluence Entry:
- Wait for the Setup: Look for the moment when the background changes color (Green for Long, Red for Short).
- Confirm with Wave Trend: Ensure the “Wave Trend Cross” aligns with the Trend Meter signal (represented by a cross icon on the meter).
- Check Pressure: Ensure there is no “Negative Pressure” dot appearing if you are trying to go Long.
- Exit: Exit when the fastest Trend Meter (usually Meter 3) changes color back to the opposite side.
Conclusion
The Trend Meter Indicator is designed for traders who are tired of “Analysis Paralysis.” By combining RSI, MACD, and Wave Trend into a single visual system, it allows you to focus on the price action while the script handles the complex calculations.
Ready to try it? Head over to TradingView, open the Pine Editor, and paste the code to start identifying high-probability trends today!