Introduction Are you tired of cluttered charts, confusing signals, and getting trapped in false breakouts? For algorithmic traders and technical analysts, understanding the true market trend across multiple timeframes is the key to consistent trading.
Today, I am sharing a complete, professional-grade Sentiment Panel v4 Pro indicator for TradingView. Built with strict no-repaint logic, this Pine Script tool combines the power of multiple technical indicators into one clean, interactive dashboard. Whether you are scalping high-volatility instruments like XAUUSD (Gold) and BTCUSD, or following trends in major indices like Nifty, this tool will visually simplify your decision-making process.
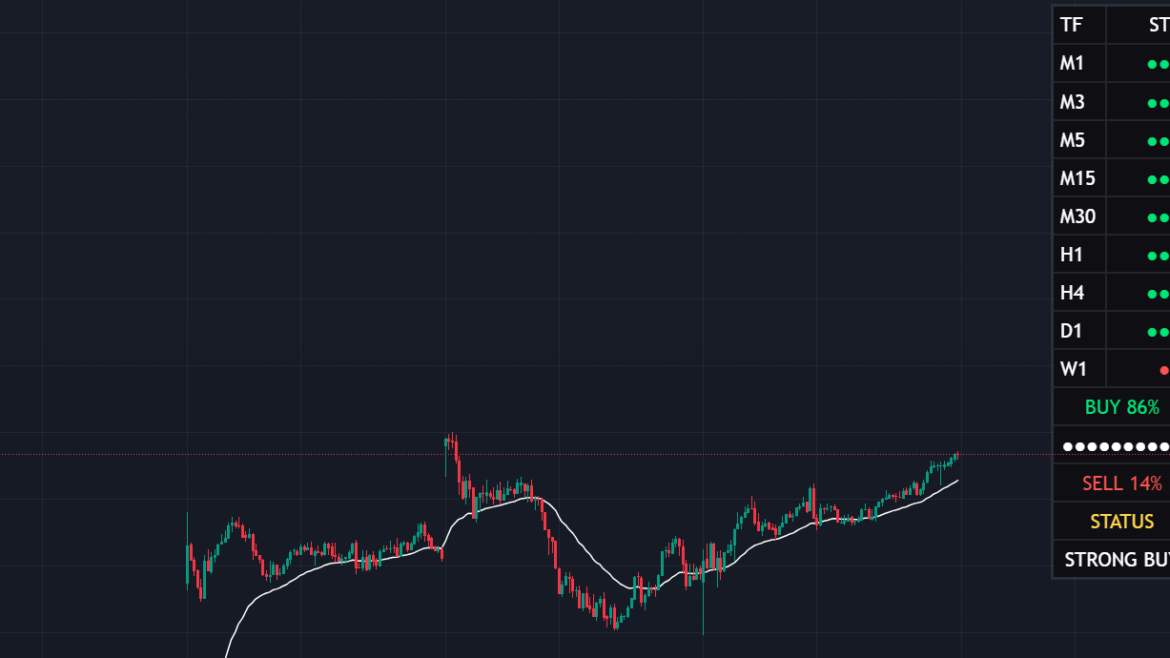
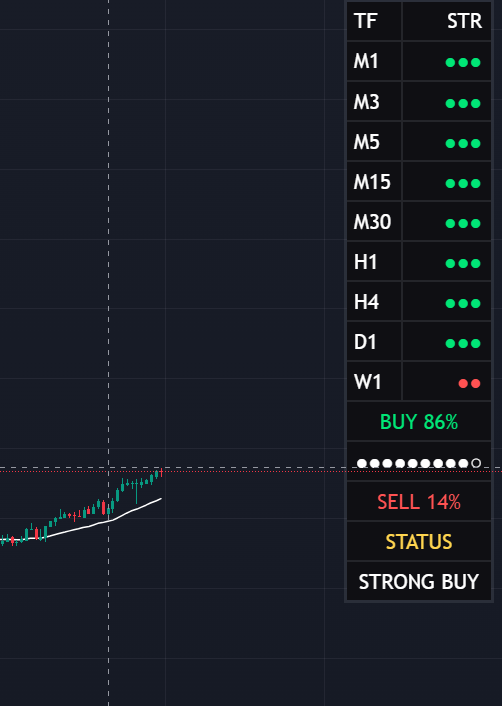
What is the Sentiment Panel v4 Pro? The Sentiment Panel is an advanced trend-following widget that calculates a “Bullish” or “Bearish” score based on 9 different timeframes (from 1-minute to Weekly). Instead of manually checking EMAs, RSI, MACD, and Volume on every single timeframe, this script does the heavy lifting for you and displays a real-time probability score directly on your chart.
Key Features of the Indicator
- Comprehensive Algorithmic Scoring: The script evaluates price action using a blend of EMAs (5, 7, 9, 20, 21, 25, 50, 200), DMI, ATR, MACD, RSI, Stochastics, and Volume Flow.
- Institutional VWAP Integration: We have integrated the Volume Weighted Average Price (VWAP) into the calculation engine to ensure you are always trading on the right side of institutional money.
- Smart Trend-Following Memory: Unlike basic indicators that spam your chart with continuous arrows, this script identifies the exact moment a new trend starts. It plots visual arrows and background lines only when the trend shifts, keeping your charts clean for accurate backtesting.
- Visual White Moving Average: A customizable White Trend MA (SMA/EMA) is overlaid on the price chart. This acts as a dynamic support/resistance line, allowing you to visually filter out weak signals.
- Real-Time Custom Alerts: Set it and forget it. The script includes built-in alert conditions for “Strong Buy” and “Strong Sell” so you never miss a major market move.
How the Scoring Math Works Behind the scenes, the panel assigns a weight to each technical parameter. The maximum score per timeframe is 12.5. The script calculates the total score across all enabled timeframes and runs it through a probability matrix to give you a clear percentage:
- > 65%: STRONG BUY
- > 52%: BUY
- < 35%: STRONG SELL
- < 48%: SELL
- In-between: NEUTRAL
How to Use This Pine Script Code
- Open your TradingView chart.
- Click on the Pine Editor tab at the bottom of the screen.
- Delete any existing code and paste the source code provided below.
- Click Save and then Add to Chart.
- Open the indicator settings to customize your preferred timeframes, table position, and Moving Average length.
Source Code :
//@version=6
indicator("Sentiment Panel", overlay=true, max_boxes_count=100, max_labels_count=100)

//-------------------------------------------------
// INPUTS
//-------------------------------------------------
group1='### Style ###'
panel_mode = input.string("FULL","Panel_Mode",options=["FULL","SMALL"], group=group1, tooltip="Choose FULL to see all Timeframes, SMALL for just the summary.")
text_size_input = input.string("Small","Text_Size",options=["Tiny","Small","Normal"], group=group1)
table_pos_input = input.string("Top Right","Table_Position", options=["Top Left","Top Right","Bottom Left","Bottom Right"], group=group1)

// TF ENABLE
group2='### TimeFrame ###'
tf1   = input.bool(true,"M1", inline = '01', group=group2)
tf3   = input.bool(true,"M3", inline = '01', group=group2)
tf5   = input.bool(true,"M5", inline = '01', group=group2)
tf15  = input.bool(true,"M15", inline = '01', group=group2)
tf30  = input.bool(true,"M30", inline = '01', group=group2)
tf60  = input.bool(true,"H1", inline = '02', group=group2)
tf240 = input.bool(true,"H4", inline = '02', group=group2)
tfD   = input.bool(true,"D1", inline = '02', group=group2)
tfW   = input.bool(true,"W1", inline = '02', group=group2)

// VISUAL MA INPUTS (NEW)
group3='### Visual Moving Average ###'
show_white_ma = input.bool(true, "Show White Moving Average", group=group3)
ma_len = input.int(27, "MA Length", group=group3)
ma_type = input.string("EMA", "MA Type", options=["EMA", "SMA"], group=group3)

//-------------------------------------------------
// TEXT SIZE
//-------------------------------------------------

txt =
 text_size_input=="Tiny"?size.tiny:
 text_size_input=="Small"?size.small:
 size.normal

//-------------------------------------------------
// TABLE POSITION
//-------------------------------------------------

tbl_pos =
 table_pos_input=="Top Left"?position.top_left:
 table_pos_input=="Top Right"?position.top_right:
 table_pos_input=="Bottom Left"?position.bottom_left:
 position.bottom_right

//-------------------------------------------------
// COLORS & THEME
//-------------------------------------------------

black = #0f0f13
white = color.white

bull  = color.rgb(0,230,118)
bear  = color.rgb(255,82,82)

status_color = color.rgb(255,213,79)
border_col = color.new(color.gray, 80) // PRO FEATURE: Subtle border for premium look

//-------------------------------------------------
// SENTIMENT
//-------------------------------------------------

calc_sentiment()=>

    score = 0.0

    f = (ta.ema(close,5)+ta.ema(close,7)+ta.ema(close,9))/3
    s = (ta.ema(close,20)+ta.ema(close,21)+ta.ema(close,25))/3
    l = (ta.ema(close,50)+ta.ema(close,200))/2

    score += close>f?1:-1
    score += f>s?1:-1
    score += s>l?1:-1

    [_,_,adx]=ta.dmi(14,14)
    score += adx>25?0.5:0

    atr=ta.atr(14)
    score += close>close[1]+atr*0.1?0.5:-0.5

    score += ta.cci(close,20)>0?1:-1

    [m,sig,_]=ta.macd(close,12,26,9)
    score += m>sig?1:-1

    score += ta.mom(close,10)>0?1:-1
    score += ta.rsi(close,14)>50?1:-1

    score += close>open?1:-1

    stoch=ta.sma(ta.stoch(close,high,low,14),3)
    score += stoch>50?1:-1

    score += volume>ta.sma(volume,20)?0.5:-0.5

    score += ta.mfi(close,14)>50?1:-1

    // --- PRO UPGRADE: VWAP ---
    vwap_val = ta.vwap
    score += close > vwap_val ? 1 : -1

    score

//-------------------------------------------------
// REQUEST TF
//-------------------------------------------------

get(tf,enabled)=>
    enabled ? request.security(syminfo.tickerid,tf,calc_sentiment()) : na

s1   = get("1",tf1)
s3   = get("3",tf3)
s5   = get("5",tf5)
s15  = get("15",tf15)
s30  = get("30",tf30)
s60  = get("60",tf60)
s240 = get("240",tf240)
sD   = get("D",tfD)
sW   = get("W",tfW)

//-------------------------------------------------
// ARRAYS
//-------------------------------------------------

vals  = array.from(s1,s3,s5,s15,s30,s60,s240,sD,sW)
names = array.from("M1","M3","M5","M15","M30","H1","H4","D1","W1")
en    = array.from(tf1,tf3,tf5,tf15,tf30,tf60,tf240,tfD,tfW)

//-------------------------------------------------
// STRENGTH BLOCKS
//-------------------------------------------------

strength_blocks(v)=>
    int r = 0
    if v > 6
        r := 3
    else if v > 2
        r := 2
    else if v > 0
        r := 1
    else if v > -2
        r := -1
    else if v > -6
        r := -2
    else
        r := -3
    r

//-------------------------------------------------
// SCORE
//-------------------------------------------------

float total=0
int count=0

for i=0 to 8
    if array.get(en,i)
        v=array.get(vals,i)
        total+=v
        count+=1

// PRO FEATURE: Adjusted Max Score to 12.5 because of VWAP addition
max_score = 12.5*count

prob_buy  = math.round((total+max_score)/(max_score*2)*100)
prob_sell = 100-prob_buy

status =
 prob_buy>65?"STRONG BUY":
 prob_buy>52?"BUY":
 prob_buy<35?"STRONG SELL":
 prob_buy<48?"SELL":
 "NEUTRAL"

//-------------------------------------------------
// TABLE
//-------------------------------------------------

// PRO FEATURE: Frame and Border styling added
var table t = table.new(tbl_pos, 2, 30, bgcolor=black, border_width=1, border_color=border_col, frame_color=border_col, frame_width=2)

if barstate.islast

    table.clear(t,0,0,1,29)

    row = 0

    //-------------------------------------------------
    // HEADER
    //-------------------------------------------------

    if panel_mode == "FULL"

        table.cell(t,0,row,"TF",
            text_color = white,
            bgcolor = black,
            text_size = txt,
            text_halign=text.align_left)

        table.cell(t,1,row,"STR",
            text_color = white,
            bgcolor = black,
            text_size = txt,
            text_halign=text.align_right)

        row += 1

        //-------------------------------------------------
        // TF ROWS
        //-------------------------------------------------

        for i = 0 to 8

            if array.get(en,i)

                tf_name = array.get(names,i)
                v = array.get(vals,i)

                //-------------------------------------------------
                // TF NAME
                //-------------------------------------------------

                table.cell(t,0,row,tf_name,
                    text_color = white,
                    bgcolor = black,
                    text_size = txt,
                    text_halign=text.align_left)

                //-------------------------------------------------
                // STRENGTH BARS
                //-------------------------------------------------

                b = strength_blocks(v)

                bars = ""

                for j = 0 to math.abs(b)-1
                    bars += "●"

                table.cell(t,1,row,bars,
                    text_color = b > 0 ? bull : bear,
                    bgcolor = black,
                    text_size = txt,
                    text_halign=text.align_right)

                row += 1

        row += 1

    //-------------------------------------------------
    // BUY %
    //-------------------------------------------------

    table.cell(t,0,row,"BUY "+str.tostring(prob_buy)+"%",
        text_color = bull,
        bgcolor = black,
        text_size = txt)

    table.merge_cells(t,0,row,1,row)

    row += 1

    //-------------------------------------------------
    // BUY METER
    //-------------------------------------------------

    meter_width = 10
    filled = math.round(prob_buy / 100 * meter_width)

    meter = ""

    for i = 0 to meter_width-1
        meter += i < filled ? "●" : "○"

    table.cell(t,0,row,meter,
        text_color = white,
        bgcolor = black,
        text_size = txt)

    table.merge_cells(t,0,row,1,row)

    row += 1

    //-------------------------------------------------
    // SELL %
    //-------------------------------------------------

    table.cell(t,0,row,"SELL "+str.tostring(prob_sell)+"%",
        text_color = bear,
        bgcolor = black,
        text_size = txt)

    table.merge_cells(t,0,row,1,row)

    row += 1

    //-------------------------------------------------
    // STATUS
    //-------------------------------------------------

    table.cell(t,0,row,"STATUS",
        text_color = status_color,
        bgcolor = black,
        text_size = txt)

    table.merge_cells(t,0,row,1,row)

    row += 1

    table.cell(t,0,row,status,
        text_color = white,
        bgcolor = black,
        text_size = txt)

    table.merge_cells(t,0,row,1,row)


//-------------------------------------------------
// TREND FOLLOWING STATE MEMORY
//-------------------------------------------------

// Ek variable jo yaad rakhega ki current trend kya chal raha hai
// 1 = Bullish Trend, -1 = Bearish Trend, 0 = Neutral
var int current_trend = 0

bool buy_signal = false
bool sell_signal = false

// Jab pehli baar STRONG BUY aaye aur pehle se Bullish Trend na chal raha ho
if prob_buy > 65 and current_trend != 1
    current_trend := 1
    buy_signal := true

// Jab pehli baar STRONG SELL aaye aur pehle se Bearish Trend na chal raha ho
if prob_buy < 35 and current_trend != -1
    current_trend := -1
    sell_signal := true

//-------------------------------------------------
// ALERTS
//-------------------------------------------------

// Ab alerts bhi continuously bajne ke bajaye sirf trend start hone par ek baar bajenge
alertcondition(buy_signal, title="Strong Buy Alert", message="Strong Buy Signal Detected! New Bullish Trend Started.")
alertcondition(sell_signal, title="Strong Sell Alert", message="Strong Sell Signal Detected! New Bearish Trend Started.")

//-------------------------------------------------
// VISUAL SIGNALS FOR BACKTESTING
//-------------------------------------------------

// 1. Chart par Arrows draw karega (Sirf jab naya signal aayega)
plotshape(buy_signal, title="Buy Arrow", style=shape.triangleup, location=location.belowbar, color=bull, size=size.small)
plotshape(sell_signal, title="Sell Arrow", style=shape.triangledown, location=location.abovebar, color=bear, size=size.small)

// 2. Chart par Vertical Background Lines draw karega (Sirf signal wale bar par)
bgcolor(buy_signal ? color.new(bull, 85) : na, title="Buy Background Line")
bgcolor(sell_signal ? color.new(bear, 85) : na, title="Sell Background Line")

//-------------------------------------------------
// VISUAL WHITE MOVING AVERAGE (NEW FEATURE)
//-------------------------------------------------

my_ma = ma_type == "EMA" ? ta.ema(close, ma_len) : ta.sma(close, ma_len)
plot(show_white_ma ? my_ma : na, color=white, linewidth=1, title="White Trend MA")
Pro Trading Tip No indicator is 100% accurate. Use this Sentiment Panel as a confluence tool alongside your own price action analysis and support/resistance zones. Always prioritize strict risk management and dynamic stop-losses when trading live markets.
Conclusion Automating your trend analysis saves time and removes emotional bias from your trading. Try out this Sentiment Panel Pro on your TradingView charts and let me know how it improves your backtesting results.
If you found this custom Pine Script helpful, don’t forget to share this article with your fellow traders and drop a comment below with your favorite timeframe settings!
Disclaimer: This article and the provided Pine Script code are for educational purposes only. They do not constitute financial advice. Trading in financial markets involves significant risk of loss.