If you are a technical trader looking for a reliable way to spot trend reversals and ride market momentum, you know how powerful Divergence and Moving Averages can be. But manually spotting these setups on a chart can be exhausting and prone to human error.
Enter the EMA Wave With Diversion, a custom Pine Script indicator designed for TradingView. Created by [www.appsportal.in], this tool combines the trend-following power of Exponential Moving Averages (EMA) with a high-accuracy divergence engine to generate precise Buy and Sell signals.
In this article, we will break down how this indicator works, its core features, and how you can integrate it into your day trading or swing trading strategy.
Tradingview Link : https://www.tradingview.com/script/YkuX5uM9-EMA-Wave-With-Diversion/
🚀 What is the EMA Wave With Diversion Indicator?
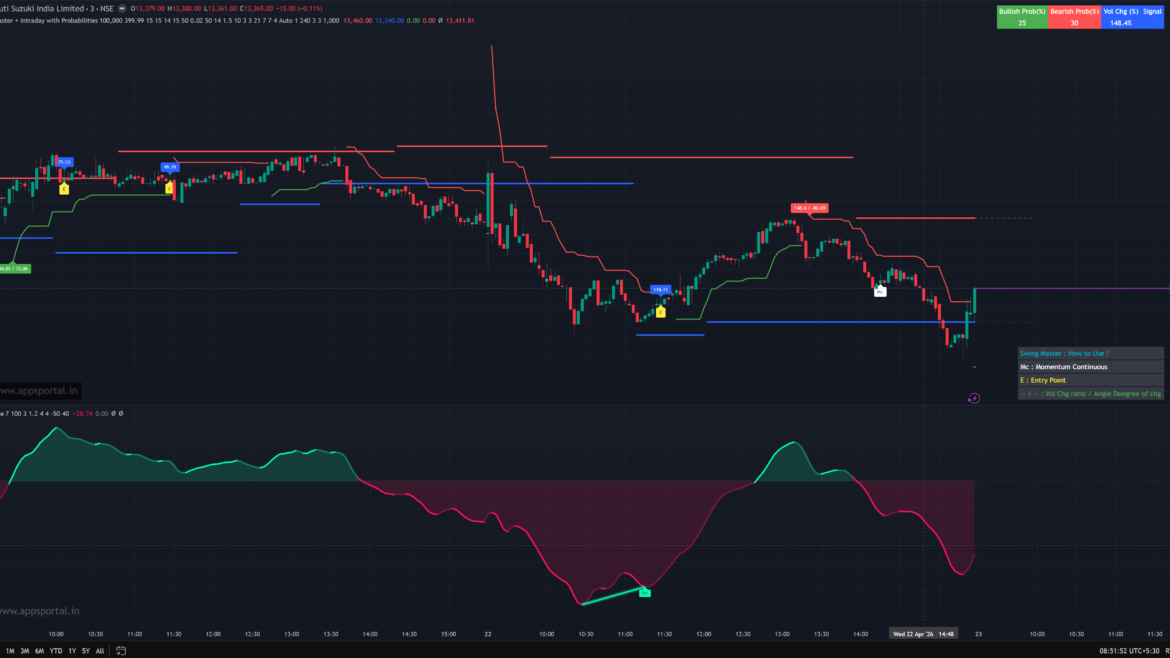
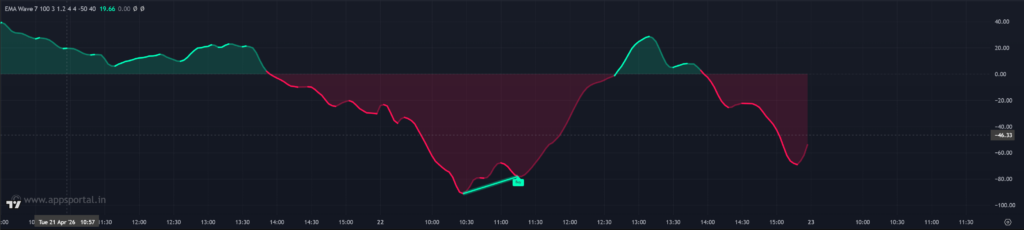
At its core, this indicator is a momentum oscillator. It calculates the difference between a Fast EMA (default length 7) and a Slow EMA (default length 100). By smoothing this difference using a Weighted Moving Average (WMA), it creates a fluid, easy-to-read “Wave Line.”
Instead of just showing you a squiggly line, the indicator analyzes the slope and acceleration of this wave to determine if the market is gaining or losing momentum.
Key Features of the Script:
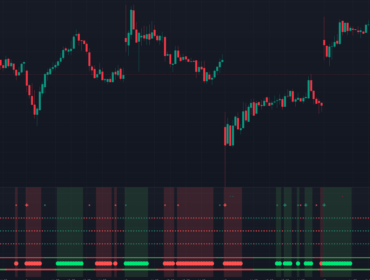
- Color-Coded Trend Clouds: The indicator fills the space between the wave and the zero-line with green (bullish) or red (bearish) clouds, allowing you to gauge the overall market direction at a single glance.
- High-Accuracy Divergence Engine: This is the star of the show. It automatically detects hidden and regular divergences between the price action and the oscillator.
- Smart Signal Dots: It prints visual dots on the oscillator when it detects a rapid acceleration in momentum at extreme overbought or oversold levels.
- Fully Customizable: Traders can adjust lookback periods, slope sensitivity, and divergence thresholds directly from the indicator settings.
⚙️ How the Code Works (The Workflow)
For the coding enthusiasts and algo-traders, here is a quick breakdown of the script’s internal logic:
1. The Momentum Engine
The script continuously tracks emaDiff = ema1 - ema2. It then calculates the currentSlope of the smoothed wave line. To filter out market noise, it compares the current slope to the avgSlope. If the current movement is significantly faster than the average, the script flags it as “accelerating.”
2. The Divergence Logic
Divergence trading is highly profitable but requires strict rules. This script uses TradingView’s pivotlow and pivothigh functions to lock in swing points.
- Bullish Divergence: It checks if the price has made a Lower Low while the oscillator has made a Higher Low. To ensure high accuracy, this must happen below a specific extreme threshold (default -50).
- Bearish Divergence: It checks if the price has made a Higher High while the oscillator has made a Lower High, occurring above the extreme threshold (default 40).
3. Visual Execution
When a valid divergence is confirmed, the script doesn’t just alert you—it draws thick, transparent lines connecting the pivot points directly on the oscillator and prints clear “Buy” or “Sell” labels.
📈 How to Trade Using the EMA Wave Indicator
Having a great tool is only half the battle; knowing how to use it is where the profit lies. Here is a simple workflow to incorporate this indicator into your trading plan:
The Buy Setup (Long Trade)
- Wait for a Bullish Divergence: Look for the indicator to print a “Buy” label along with a green divergence line below the zero line.
- Check the Trend Cloud: Ensure the wave line is starting to curve upwards and change to a brighter green color.
- Look for the Signal Dot: A green dot indicates that bullish momentum is accelerating. This is your trigger to enter the trade.
The Sell Setup (Short Trade)
- Wait for a Bearish Divergence: Look for the indicator to print a “Sell” label along with a red divergence line above the zero line.
- Check the Trend Cloud: The wave line should be pointing downwards and turning a sharp red.
- Look for the Signal Dot: A red dot confirms that the bearish momentum is picking up speed, signaling a strong short entry.
💡 Conclusion
The EMA Wave With Diversion is a brilliant all-in-one script that removes the guesswork from momentum and reversal trading. By automatically drawing divergence lines and highlighting momentum acceleration, it saves traders hours of chart screen time.
(You can paste your actual Pine Script code block here on your blog so users can copy it into their TradingView accounts).
Disclaimer: All trading involves risk. This article and the provided Pine Script are for educational purposes only and do not constitute financial advice. Always backtest any indicator or strategy on a demo account before risking real money in the financial markets.